
Statistics and comparative analyses
Real-time statistics and comparison of your scenarios
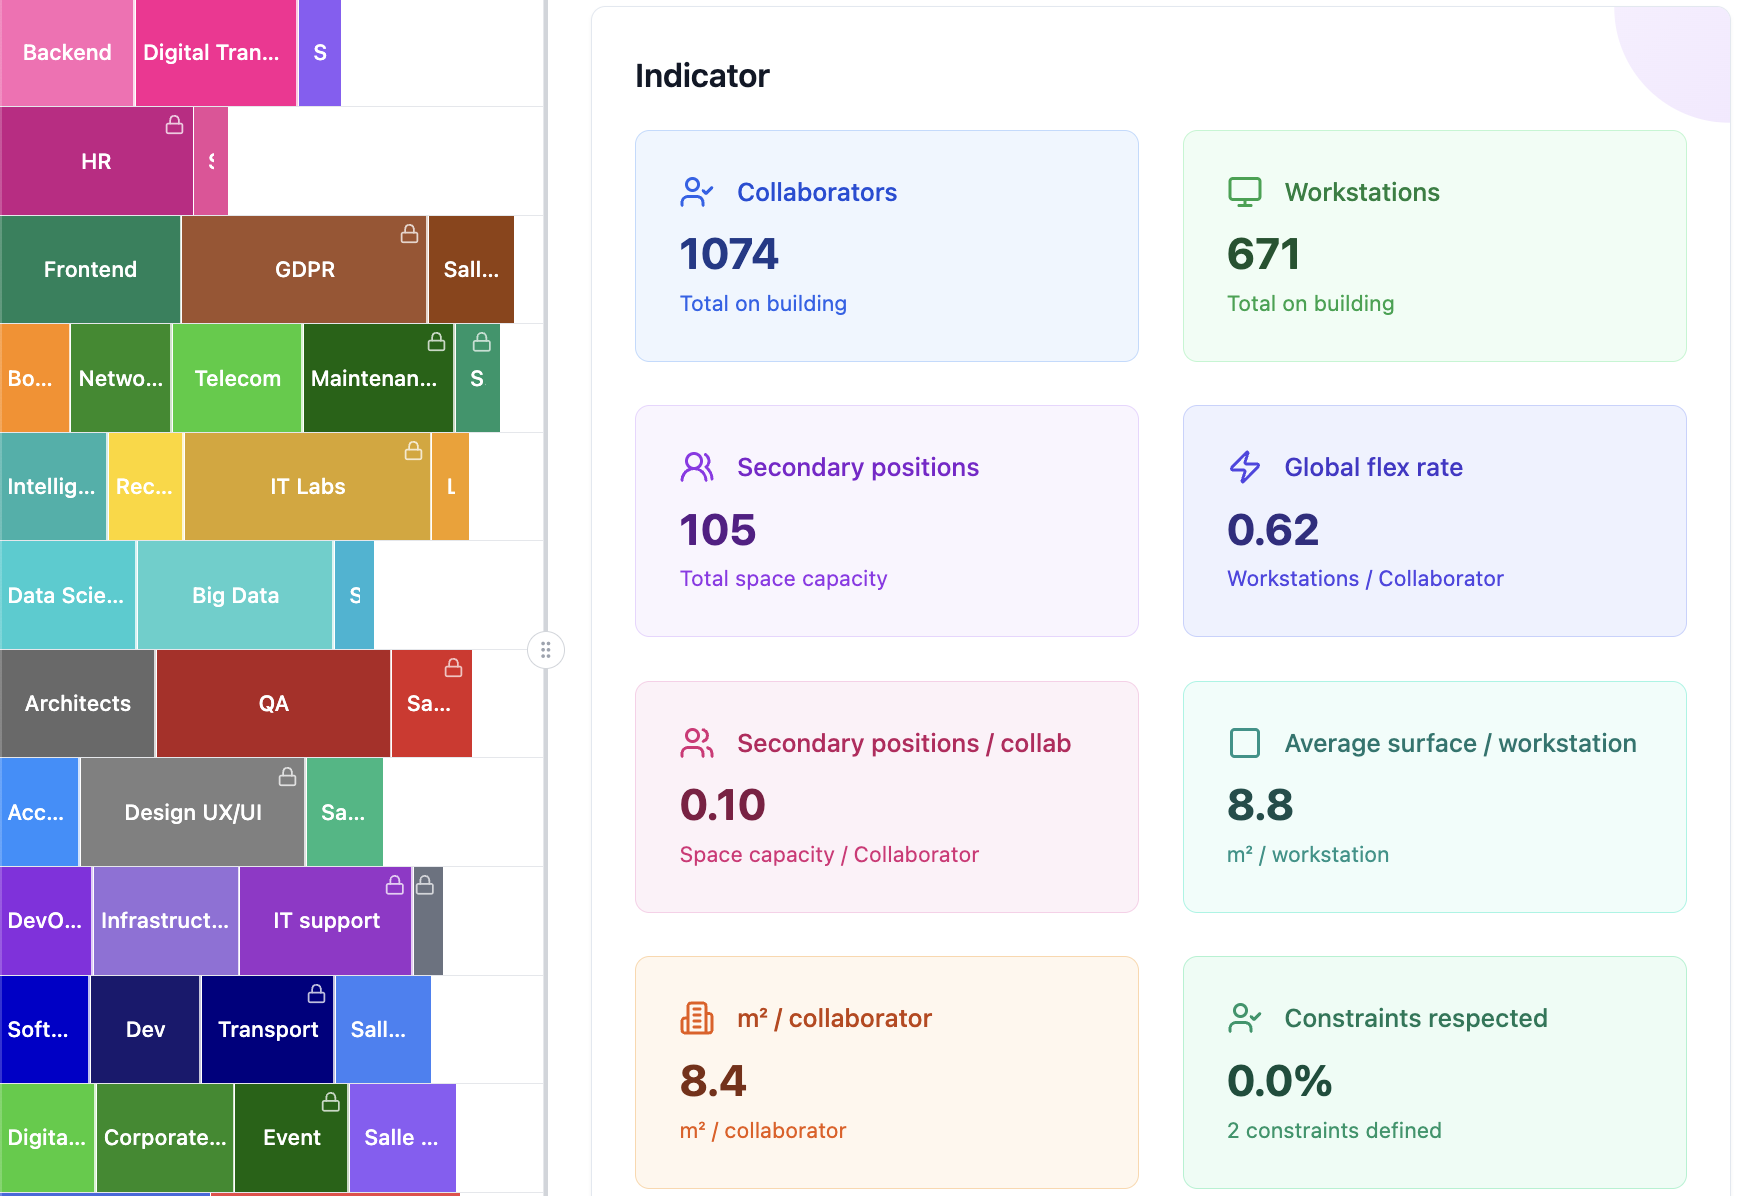
Thanks to dynamic indicators, you have an updated view at any time on the occupancy rate per floor and per team, the overall flex rate and per team. This data allows you to continuously verify compliance with standards and anticipate necessary adjustments.
Compare your scenarios at a glance with clear and intuitive charts. Visualize the distribution of surfaces (offices, collaborative spaces, service spaces) for each scenario and quickly identify the impacts of your layout choices.
Visualize how each hypothesis affects floor occupancy, flex rate, and space distribution (collaborative, individual, services). The summary report will allow you to present a detailed analysis of scenarios and simplify decision-making.
Summary report
An automatically generated document that contains all your data
Stacking plan
Color visualization of the stacking plan with team distribution by floor
Real estate program
List of teams and spaces by floor, with capacity and associated surface area, in table format (available in PDF and Excel versions)
Constraints table
List of business and structural constraints. Indication of constraints respected or not by scenario
Scenario comparison
Compare key indicators by scenario (surface per position, flex rate, proportion of collaborative spaces / workstations, percentage of constraints respected)
Instant summary
Generate a summary report adapted to the needs of architects and clients
Types of data that can be exported
Facilitate decision-making with our summary documents
HR data
Statistics on surface area per employee, flex rate per team, number of secondary positions per employee.
Real estate program
Excel table summarizing all teams and spaces, with their associated surfaces and capacities.
Stacking plan
Visualization of your stacking scenarios in image format to insert in your presentations
Constraints and synergies
Consolidation of business constraints and synergies identified and listed during the project